Node-RED is a visual programming tool used to create commands for IoT devices such as a Blues Wireless Notecard. This programming tool allows the user to wire flow functions and deploy to runtime without having to write in a programming language. This guide will give an example on how you can create your own custom dashboard with Node-RED by retrieving data from a Blues Wireless Notecard.
I chose to create my own custom dashboard using Node-RED because I enjoy using the visual function nodes to create commands. This allows me to enhance a new type of programming skill instead of coding within a programming language.
The first step to creating a custom dashboard is to complete the sensor tutorial from Blues Wireless. I will insert my C++ sensor code to view as a reference here. For this code example I used Arduino IDE, BME680 environmental sensor, and the Feather Starter Kit for Swan with the SWD Programmer & Debugger from Blues Wireless. After reviewing this reference code, shown at the very bottom there is a delay of 600,000 milliseconds. This time delay explains that the data is being stored to Notehub every 600 seconds (10 minutes), but for your own testing purposes I would set it at a lower delay to ensure measurements are being taken accurately. The raw data being stored from my BME680 sensor is current temperature (in Celsius) and humidity.
Tips before getting started:
- JSONata Exerciser is a great testing tool that I used to transform JSON data. This tool was easy to use, and the Jsonata Documentation enhanced my Node-RED experience.
- The “Running Node-RED locally” installation guide will allow you to get started using the OS of your choice.
How to create a custom dashboard using Node-RED:
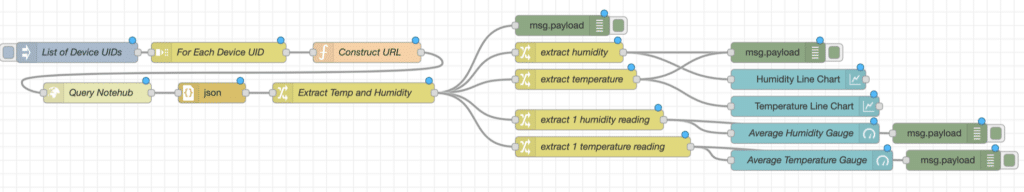
- Creating your first flow will be a helpful guide for first time Node-RED users. Shown below is a reference flow that displays how I structured my custom dashboard.

- Start by creating your inject node with device ID numbers (separated by a comma if needed) and store them as a payload. The split node that comes after the inject node will only be used if listing more than 1 device ID.
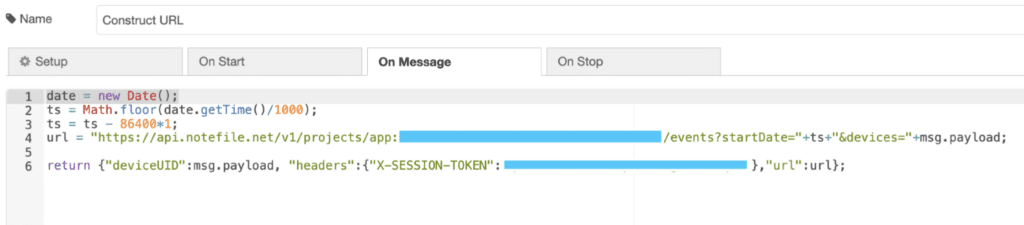
- Constructing the URL using Node-RED’s function node is important for communicating with Notehub.io. This node will allow users to interact with Notehub using our Notehub API and retrieve existing project information such as “Get Events by Project”. The URL shown below was structured by adding
events?startDate=.
Using newDate( )returns a time that represents the current date and time. The functionMath.floor( )was used to remove any decimals that could return from the calculationdate.getTime( )/1000. This function would return the number of seconds since 1 January 1970, otherwise known as Unix Epoch time. The value stored intswould return the Epoch timestamp in seconds multiplied by number of days I wanted to retrievesensors.qofile events from Notehub.
- The HTTP request node is an optional property node that sets the URL and method of the request. This node is optional to make basic requests such as GET, PUT, POST, PATCH, or DELETE from your Notehub API.
- The JSON parser node is used to convert the JavaScript object to a JSON string for the output payload.
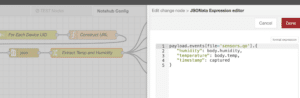
- Once the output payload is set you will edit your
change nodeto collect Notehub event data. In order to extract temperature and humidity it must be pulled from thesensors.qofiles. To achieve this, I used the JSONata Exerciser as a tool to demonstrate my output. Using this tool allowed me to test my JSONata expressions from a JSON input that was retrieved from my Event API. Illustrated below is an example of how I tested extracting the raw data. In the change node “Extract Temp and Humidity”, thebody.humidity,body.temperature, and capturedtimestampwill be extracted.
- The humidity and temperature line chart configuration was accomplished by following the Node-RED Dashboard Charts guideline. To output stored data, you will need to process your data into the set structure shown in the “line charts” example given. More specifically, I used the example guideline for non-timeseries data. I set my series to output humidity or temperature while my data included the timestamp as my
xand humidity or temperature as myy.[ { "series": ["Humidity"], "data": [[*.{"x":timestamp, "y":humidity}]], "labels": [""] } ] - In order to extract the most current temperature and humidity reading from Notehub, I used an additional
changenode that set my payload to the most recent temperature or humidity reading. This reading was at the very end of the large array, and I used the value [-1] to send off to my dashboard gauges. I also made sure to$round( )to the nearest whole number so my gauge was readable. Node-RED offers a great debugger message output tab that allows me to check the output of any node. Using the debugger allowed me to track the most recentsensors.qofile.
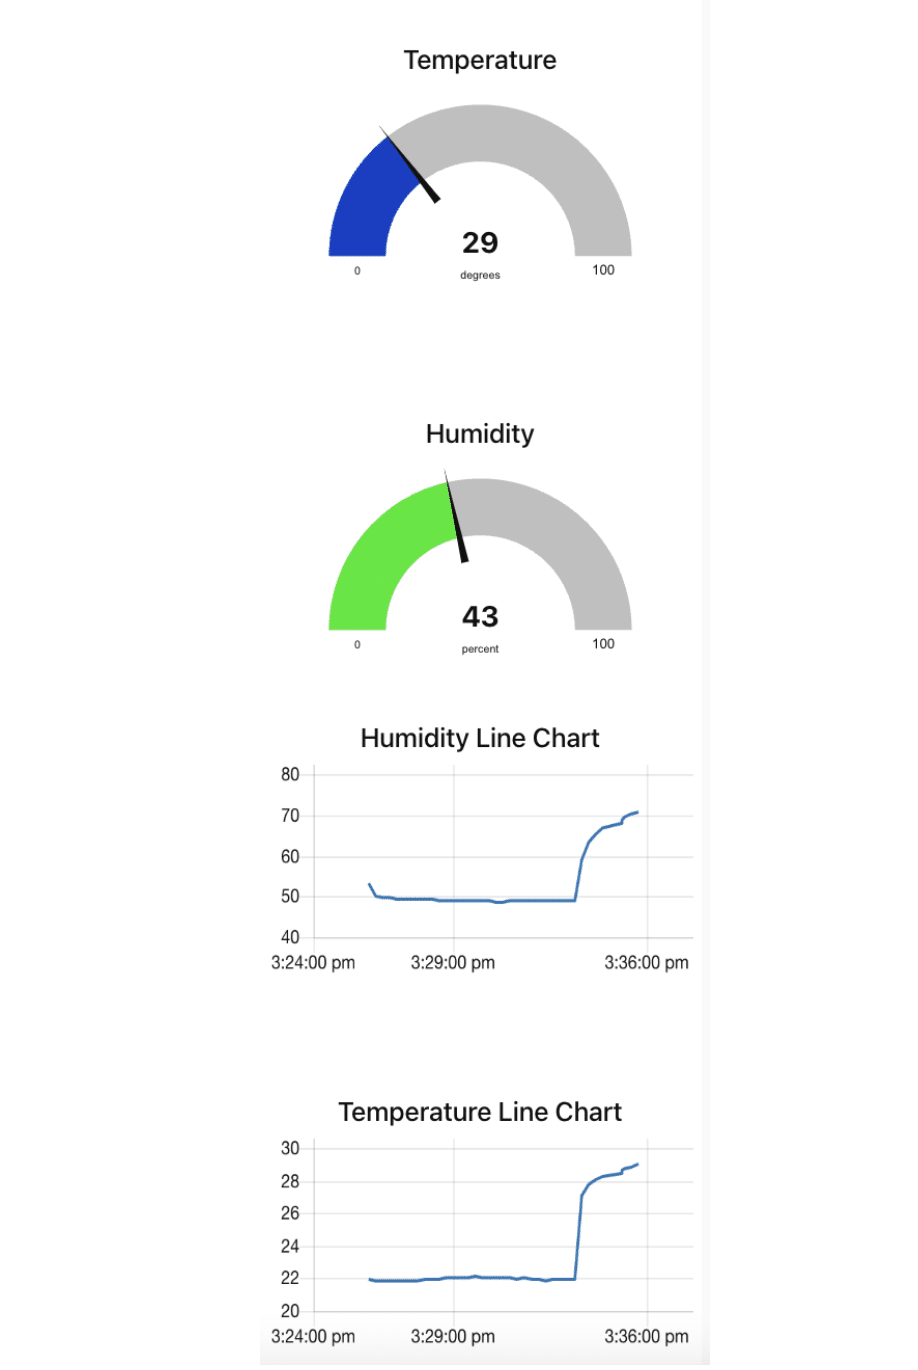
That’s it! Shown below is the final output our Node-RED dashboard that is running on my Macbook. Tag @blueswireless and share your thoughts on Twitter if you decide to follow this tutorial for your own dashboard!