The day after Thanksgiving my parents’ car was stolen out of the driveway while we were all inside eating dinner. There was a screech of tires, I went to the door to see about the noise and watched their car heading down the driveway and out of sight at high speed.
We called the police, filed a report, and normally that would have been the end of it. The car didn’t have LoJack®, OnStar® or any other built-in GPS tracking systems. It did, however, have a Blues Wireless Notecard and Notecarrier AL attached to a battery in the backseat recording GPS coordinates every 10 minutes.
And so begins the tale of how a hobby React asset tracker dashboard became a low fidelity LoJack® tracking a stolen car in the St. Louis area.
As the situation began to unfold, I started live-tweeting what was happening. If you’d like to see the drama in real-time, you can read this Tweet thread:
This is wild. My parent’s car was just stolen out of the driveway while we were inside having dinner.
BUT there’s a @blueswireless Notecard in the backseat right now, that’s taking GPS location readings every 10 minutes and reporting them to a cloud dashboard.
🧵
— Paige Niedringhaus (@pniedri) November 27, 2021
Let’s Talk About How We Got Here
In my previous blog post, I discussed how Blues Wireless makes getting started with IoT development easier in the same way that Create React App makes spinning up a new React application easier. And that’s awesome.
But once that sensor data from an IoT device is flowing in to Blues’ Notehub application, that’s only half the battle. The other half is getting that data back out of and turning it into something useful in the form of charts and maps.
Luckily, Blues makes that pretty darn easy as well. Not only does the data from sensors come in to Notehub in the form of JSON, Notehub also sends JSON back out to wherever you want.
It can push that data pushed via Notehub routes wherever you want: low code platforms Quibtro or Datacake, or other cloud providers like AWS or Microsoft Azure. Or it can be pulled from Notehub via the Notehub API: this is great for getting up and running quickly, building proof of concept apps before you stand up a third-party database.
Today I’ll show you how to take a Notecard and my React-based application and make your own asset tracker dashboard. The app pulls data from Notehub, renders that data in charts and maps, and regularly fetches new data to update the UI. Ready?
Configure your Asset Tracker Hardware
Before we get to the dashboard code itself, let’s set up a new Notecard project to generate data for the dashboard.
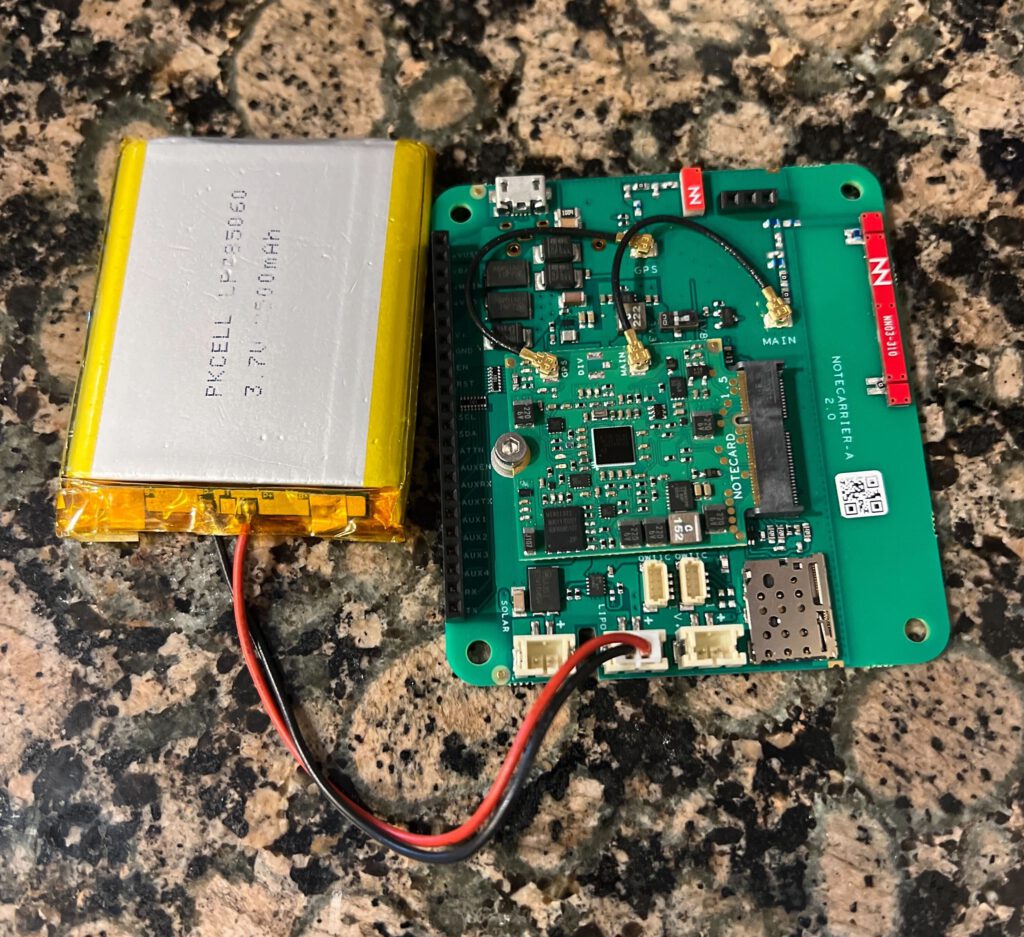
IoT Hardware List
Here’s the equipment you’ll need to make this project happen:
- Blues Wireless NB-IoT & LTE-M Notecard Global
- Blues Wireless Notecarrier AL with LiPo battery connector
- LiPo battery from an IoT supplier like Adafruit (mine is the 3.7v 2500mAh version)
Initial Notecard and Notecarrier AL Configuration
To keep this portion of my post more evergreen, I’m going to point you to the Blues quickstart guide to set up a Notecard, Notecarrier, and Notehub project, and the Blues asset tracking guides for the commands needed to configure a Notecard for GPS location tracking.
In addition to these instructions, there’s a few important caveats to make this asset tracker work for our purposes.
- When setting the
inboundandoutboundtime periods in yourhub.setrequest, make the time period for each 10 minutes. The reason being, there’s no way to force a remote update from Notehub when things like environment variables changes, so if we need the Notecard to read new environment variables shortly after they’re added, the sync times between Notehub and the Notecard need to be regular. - In the final config step of
card.location.trackwhere we start the tracker running, include the property of:"sync":true. This property means as soon as a new event is acquired by the Notecard (a new GPS location, in this case), the Notecard will sync the event to Notehub instead of waiting for its regularly scheduledoutboundtime.
If you’re curious, here’s all of the commands I used to set up my Notecard from start to finish using the built-in web REPL on the Blues Developers site.
{"req":"card.restore","delete":true}
#factory reset card

{"req":"hub.set","product":"com.blues.[NOTEHUB_PROJECT_ID_HERE]","mode":"periodic","outbound":10,"inbound":10}
#attach tracker to Notehub project, set it to periodic mode,
#sync outbound reqs every 10 mins and inbound reqs from Notehub every 10 mins

{"req":"card.location.mode","mode":"periodic","seconds":360}
#tell card how often to get GPS reading and only when motion is detected

{"req":"card.location.track","start":true,"heartbeat":true,"hours":12,"sync":true}
#start tracking, issue heartbeat every 12 hours when no motion detected,
#sync data with Notehub as soon as a tracking event is acquired (this is an important one)
The Asset Tracker Software
This dashboard was a fun challenge to build, and it turned out be much more useful than I could have imagined when it was put to the test in a real-world situation.
Technology Powering the Low Fi LoJack® Tracker App
I chose to build this application using the following technologies:
- The React-based framework Next.js for its built-in server-side rendering and API data fetching capabilities
- Typescript
- React Leaflet and Mapbox for my map component
- Recharts for my chart components
- React Table for my list of events from Notehub
The Dashboard Look and Feel
Low Fi LoJack® App
When all is said and done, the dashboard looks like this short video above: charts, map and list of events.
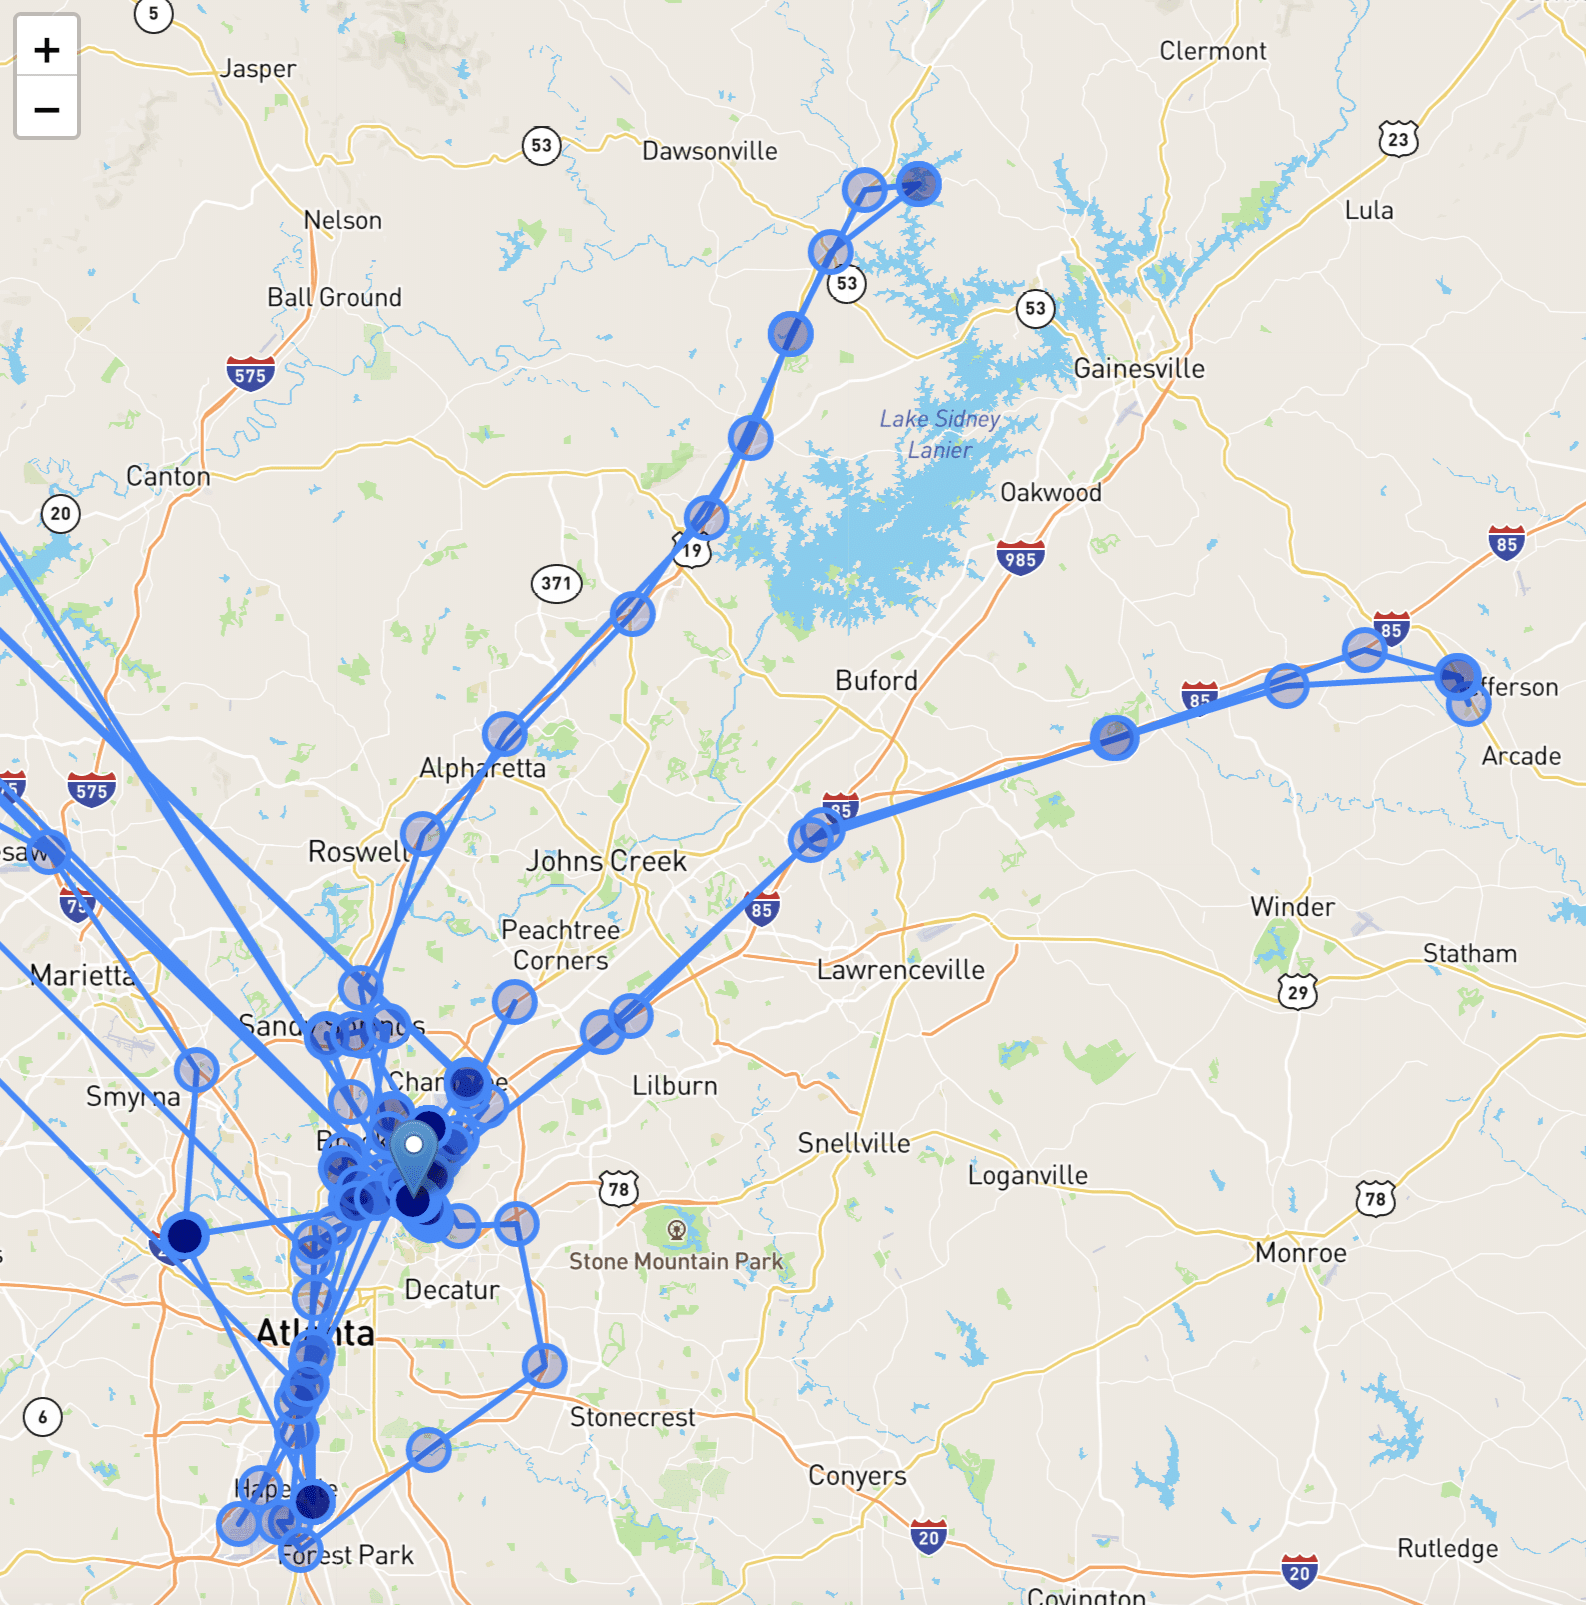
Tracker Map
The map is using the React Leaflet library to map all the coordinates from Notehub, display them on the map as blue circles, draw the lines between each circle, and display a marker with clickable tooltip of last recorded location. Mapbox provides the actual map style displayed in the component.
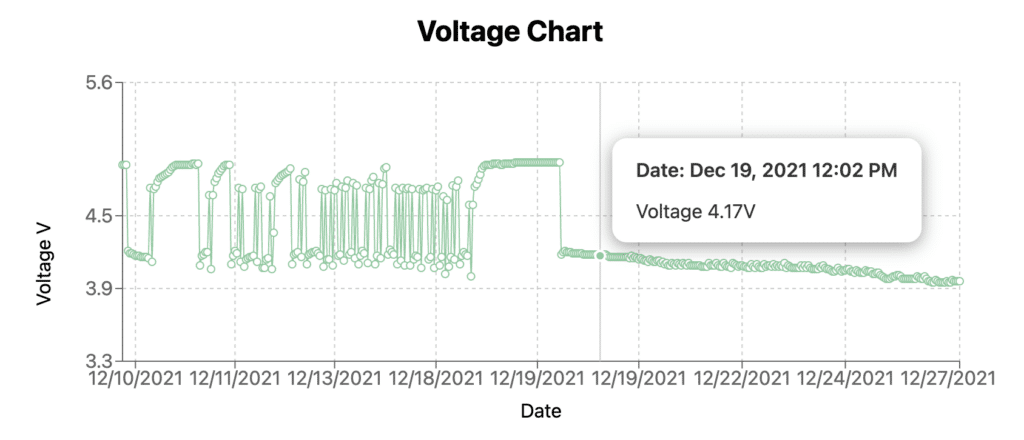
Tracker Charts
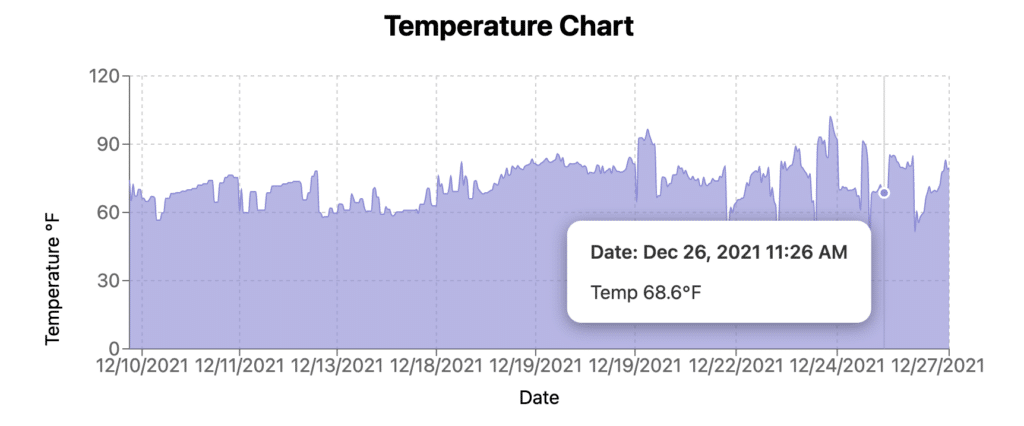
Recharts is displaying both the temperature of the Notecard and the voltage every time a GPS location reading is taken. It also has tooltips to display relevant information when a user hovers over the chart.
Tracker Events
For a sanity check as much as anything else, there’s an event list in a React Table at the bottom of the application showing a paginated list of all the events the dashboard has pulled from Notehub. It shows when the last event was received and a couple of other pieces of information so it’s easy to tell, at a glance, what’s going on.
Interesting Notes about How the Dashboard’s Built
If you’re ready to set up your own asset tracker dashboard, skip to the next section, but if you’re interested in some of the challenges I ran into along the way and how I solved for them, read on:
- I pulled data via the Notehub API instead of using WebSockets to accept data pushed via Notehub Routes.
Many of the low-code dashboard platforms rely on Notehub’s routes to push Notecard events to them, but doing that, there’s no way to get historical data from Notehub that occurred before the route was hooked up.
To get my React app up and running and populated with data quickly, I decided to use the Notehub API to fetch events directly from Notehub. The Notehub API requires users to create an authorization token to be passed along with requests, but the process is well documented, as is the API to fetch all events and then filter down to the events I wanted on my end (_track.qo events in this case).
Doing it this way also eliminated my need for a persistence layer of some sort in the form of a database, although for a production ready app I would recommend going this route.
- The map component needs server-rendered data. Next.js makes it easy.
Another interesting challenge I ran into is that in order to render all the data points and connecting lines on the map, the data must be fetched at app build time, not after the component’s rendered.
At first, I built a simple refreshPage() function to run on an interval and force-refresh a page to server-side render and refetch fresh data from Notehub.
Then I found a better way: incremental static regeneration. ISR allows you to create or update static pages after the site’s been built without need to rebuild the entire site. The key is an optional revalidate parameter that tells the getStaticProps() function fetching the data server-side to re-fetch new data on an interval specified in seconds and re-generate the page.
Once I’d figured out how to fetch the data on the server-side and get all the events out of Notehub via the API, it was a simple matter of transforming the data into the shape the app needed to render its various components.
Make the React Dashboard Work for You
Ok, so let’s make your own tracker app connected to your own Notecard and Notehub project.
Run Low Fi LoJack® Locally
- Download the asset tracker app code
First, go ahead and fork my asset tracker repo in GitHub.
Clone or download it to your local machine.
$ git clone https://github.com/paigen11/react-gps-asset-tracker-dashboard
- Install all the project dependencies
Open up your code in your IDE of choice: VSCode, WebStorm, Sublime, Atom, etc.
In a terminal, at the root of the project, run npm install to download all the project’s dependencies.
$ npm install
- Generate an access token for Notehub
To access the events in Notehub, you’ll need to generate an access token. The documentation to generate the token is straightforward. Open a terminal instance and follow the instructions.
$ curl -X POST
-L 'https://api.notefile.net/auth/login'
-d '{"username":"[you@youremail.com]", "password": "[your_password]"}'
Copy this token after it’s generated – you’ll be putting it into your project shortly.
- Create a
.env.localfile at the root of the project
This .env.local file is how Next.js automatically reads in environment variables used at build time or on the client side. All the variables you’ll need are build time variables so none of them need to be prefixed with NEXT_PUBLIC_, which allows for variable access on the client side.
These are the variables you’ll need to add to the file:
NOTEHUB_PROJECT_ID=APP_ID_GOES_HERE # get this from Notehub
NOTEHUB_TOKEN=NOTEHUB_GENERATED_TOKEN_GOES_HERE # paste in token generated in previous step
MAPBOX_ACCESS_TOKEN=MAPBOX_ACCESS_TOKEN_GOES_HERE_IF_NOT_USING_MINE # if you have your own Mapbox API token, add it here
- Start up the app and see if you’re getting data
Once all the local environment variables are set with your Notehub credentials, and the project dependencies have been installed, start the app up locally by typing npm run dev at the root of the project.
$ npm run dev
If everything goes according to plan, when you go to http://localhost:8080 you should see something like the screenshots in this article in your browser.
Deploy Low Fi LoJack® to Netlify
It’s cool to have this up and running on your local machine and all, but what about if you want to deploy it somewhere where other people can see it?
The quickest and easiest solution I would recommend is the Netlify platform.
I deployed my own version of this app to Netlify in order to share the map and history with the police detective working to recover the vehicle after it was stolen.
- Sign up for a free Netlify account
If you don’t already have a Netlify account, sign up for a free one.
- Grant Netlify access to your GitHub repo
After you’ve logged in to Netlify, you’ll need to follow these instructions to grant Netlify access to your GitHub GPS tracker repo.
- Set Netlify environment variables during first deployment
During the very first build and deployment of your repo on Netlify, you’ll need to add the environment variables we set locally via our .env.local file via Netlify’s build and deploy variables.
After you’ve selected the repo you want Netlify to build, click the “Advanced Build Settings” button, and add each key-value pair from your .env.local file as a new variable here.
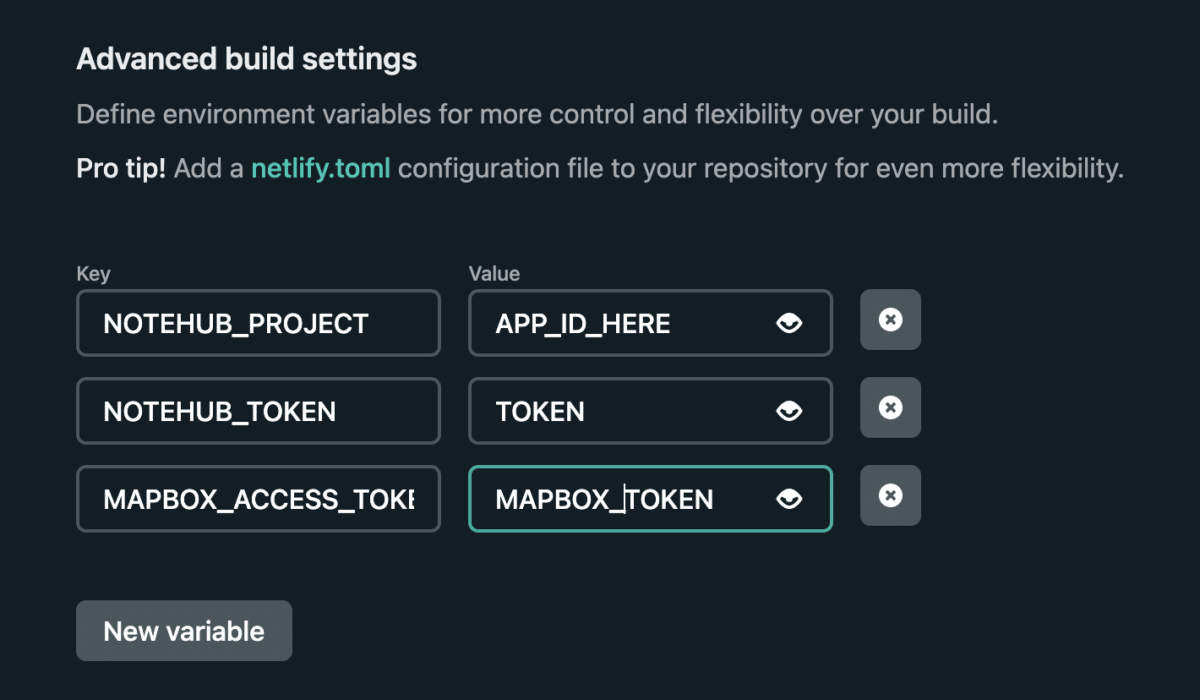
These variables need to be protected on the server side because they give access to Notehub, your project, etc. and shouldn’t be stored in GitHub or anywhere else accessible by the general public.
Beyond these steps, the netlify.toml file in the root of the project handles the rest of the Next.js deployment on Netlify without having to do much else.
[build]
publish = ".next"

[[plugins]]
package = "@netlify/plugin-nextjs"
The secret is the @netlify/plugin-nextjs package – it takes care of all the more complicated parts of deploying a Next.js app so you don’t have to.
The Grand Theft Auto Conclusion
For about an hour after the car was stolen we were able to follow it around on my app’s map because my asset tracker remained undetected in the backseat. After that, the thieves discovered it and ditched it in a park and a few days later the police retrieved it – the tracker was still transmitting its location every 12 hours even though no new motion was detected.
I want to give a special shout out to my coworker Sean, who jumped on a Slack call 20 minutes after the car was stolen and helped me remotely update the Notecard via Notehub environment variables to take more frequent GPS readings so we could more closely follow the car in real time. I feel fortunate to work with such good people.
By the time the tracker was returned to my parents, I’d already left for my own home, so they mailed it to me, and since it was still operating fine, I was able to track its progress via USPS as it made its way towards me.
Here’s the tracker when it arrived back at my house.
Over a month after the car was stolen it was found abandoned in terrible condition in an impound lot: bullet holes in the roof (which ruined the interior), dents and scratches on every outside panel, the stench of marijuana inside, an extra 2,500 miles on the odometer, and that’s just what could be seen without checking under the hood.
Hopefully the insurance company will write it off.
Where to go from here
Make and deploy your own asset tracker – from hardware to software it’s all available with Blues tech and my dashboard app code. You can even use this discount code to get 20% off your first development kit purchase.
There’s also a ton of ways this tracker dashboard could be even better. Improvements could include:
- An option to download event data to a spreadsheet for easy sharing
- Customizable timeframes via a date picker to see different amounts of events on the map and the charts
- Add a cloud database that Notehub can push new events to reducing the amount of direct queries to Notehub
I actually extended this idea into another project where I made an SOS-equipped dashboard during a day-long internal company hackathon.
It follows the same principles as the project here, but includes an “SOS Mode”, which updates the Notecard remotely to do more frequent GPS location locks, and displays it on the dashboard with a red colored line.
What will you follow with your own asset tracker?
LoJack® and OnStar® are registered trademarks of the LoJack Corporation and OnStar, LLC. respectively.