If you’ve ever wanted to turn raw IoT data into tables, graphs, or other cool data visualizations but wanted more fine-grained control over how the data was stored and displayed than most low-code tools provide without having to build a complete app from scratch, Snowflake and Streamlit are two tools you need to check out.
What are Snowflake and Steamlit?
Snowflake is a data cloud offering high performance data management at massive scale, ideal for people who want performant, flexible, secure data warehousing in the cloud. It offers a fully managed service that can store large amounts of data, power complex data pipelines and analytics, scale efficiently, and automate complex data replication and sharing.
Streamlit is an open-source Python library that makes it easy to create and share custom web applications for machine learning and data science with just a few lines of Python code – no need to write a backend, define routes, handle HTTP requests, connect a frontend, write HTML, CSS, JavaScript, and all the rest. Instead, just use the Streamlit API in a Python program to visualize, mutate, and share data in whatever ways you want. Text and images, tables, charts, widgets, graphs – it’s all there and more. It provides the options and customizations of a built-from-scratch app without the time consuming hassle of actually having to build it from scratch.
And the icing on the cake? Snowflake data can integrate seamlessly with Streamlit applications.
How does Blues Wireless fit in to all this?
When Blues Wireless saw how Streamlit was making data visualizations for data scientists and other Python devs quick and easy, we wanted to bring that same option to our IoT customers who want to see the data their Notecard-powered IoT devices are recording and sending to Notehub.
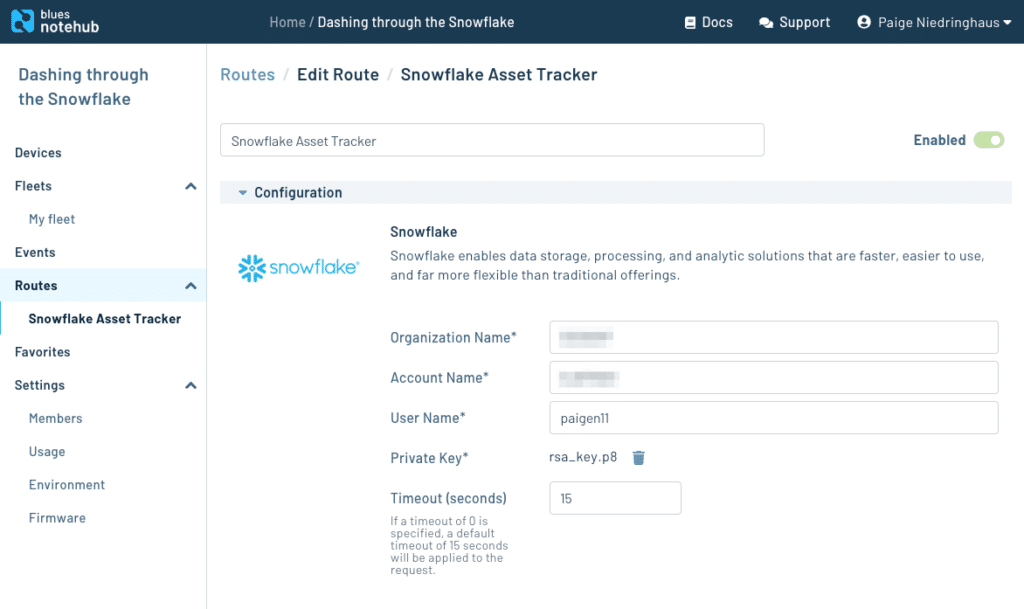
So now, Blues has an officially supported route in Notehub to make sending data from Notehub to Snowflake very straightforward.
How it works
- Sign up for a Snowflake account, create RSA keys to allow Notehub and Snowflake to talk to one another, and route JSON data out of Notehub to the Snowflake REST API.
- In Snowflake, use SQL syntax to parse the JSON data and grab the pieces you want, and add them to a new view.
create or replace view
    tracker_vw
as select
    payload:event::STRING as id,
    payload:device::STRING as device,
    payload:when::TIMESTAMP as created,
    payload:best_lat::FLOAT as lat,
    payload:best_lon::FLOAT as lon,
    payload:best_location::STRING as location,
    payload:best_location_type::STRING as location_type,
    payload:best_timezone::STRING as timezone,
    payload:best_country::STRING as country,
    payload:body.temperature::FLOAT as temp,
    payload:body.motion::FLOAT as motion,
    payload:body.voltage::FLOAT as voltage
from tracker_data;

select * from tracker_vw;
- Install Streamlit, connect to the Snowflake database, and go to town with the Streamlit API options.
import streamlit as st
import pandas as pd
import snowflake.connector

# Initialize connection.
@st.experimental_singleton
def init_connection():
    return snowflake.connector.connect(**st.secrets["snowflake"])

conn = init_connection()

# Perform query.
@st.experimental_memo(ttl=600)
def run_query(query):
    with conn.cursor() as cur:
        cur.execute(query)
        return cur.fetchall()

"""
# Asset Tracker Data

This page shows asset tracker environment readings and device location from a Blues
Wireless Notecard.
"""

"""
### Options
"""
num_rows = st.slider('Rows to fetch?', 10, 500, 100)
sort = st.selectbox('Sort?',('asc', 'desc'))
show_table_data = st.checkbox('Show table data?', True)
show_charts = st.checkbox('Show charts?', True)
show_map = st.checkbox('Show map?', False)

location_rows = run_query(f'SELECT * from tracker_vw ORDER BY created {sort} LIMIT {num_rows};')
location_data = pd.DataFrame(location_rows, columns=("ID", "Device", "Created", "lat", "lon", "Location", "Location Type", "Timezone", "Country", "Temp", "Motion", "Voltage"))
In next to no time, you can have an interactive, fully customizable dashboard of your IoT data, only Python required.
Where to go from here?
For a more thorough, step-by-step guide to getting started with Snowflake and Streamlit for your own IoT project, we have a complete guide in our developer documentation.
If you have any questions, or find any issues, feel free to reach out in our forum, and have fun bringing your own IoT data to life more quickly!